

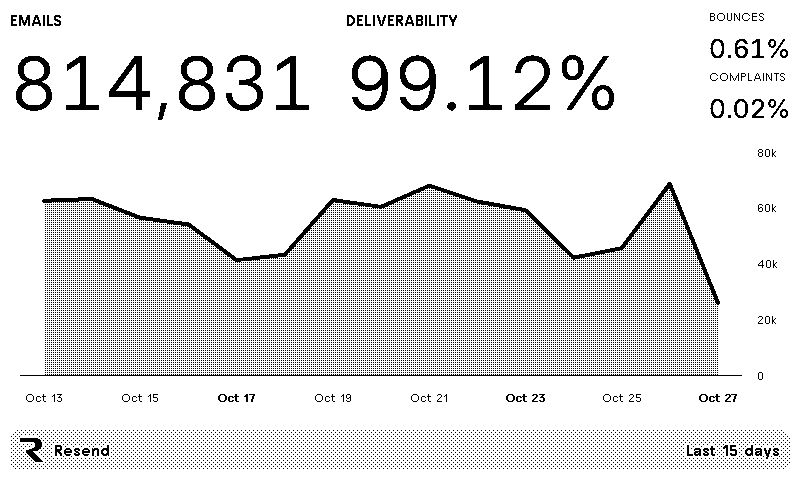
What the plugin shows
The plugin covers the last 15 days, including today. That’s the same default range as the Metrics page.- Emails: The number of emails sent.
- Deliverability: The share of sent emails that the recipient’s mail server accepted.
- Bounces: The share of sent emails that bounced.
- Complaints: The share of delivered emails that recipients marked as spam.
- Chart: Emails sent per day, bucketed by the time zone set in your TRMNL account.
0%. Every account must stay under a 4% bounce rate and a 0.08% spam rate.
Connect Resend
1
Add the plugin
Open the Resend plugin in TRMNL and add it.
2
Sign in to Resend
- Click Connect.
- Sign in to Resend.
- Approve access for your team.
full_access because the Metrics API requires it; this scope permits access to every API route, including write operations, though the plugin only reads metrics.3
Add it to a playlist
Add the plugin to a TRMNL playlist. The display picks it up on its next refresh.
Layouts
The plugin supports every TRMNL layout (full, half horizontal, half vertical, and quadrant). Use it on its own or in a mashup with other plugins. The full layout shows all four numbers and a chart with axes.How often it refreshes
TRMNL fetches new metrics from Resend every 15 minutes. The Metrics API also caches responses for up to 15 minutes, so the display can trail the Metrics page by up to about half an hour. When the display shows the new data depends on your device’s own refresh rate.Troubleshooting
The screen says “Couldn’t load metrics”
The plugin couldn’t read metrics from Resend, and the screen shows the error Resend returned. This usually means the connection’s access was revoked or expired. Open the plugin in TRMNL and click Connect again to sign in to Resend.The numbers don’t match the Metrics page
Check these in order:- Team: The plugin shows the team you approved access for when you connected. Make sure you’re viewing that team’s Metrics page.
- Date range: The plugin always shows the last 15 days. Set the Metrics page to the same range to compare.
- Time zone: The chart groups days by the time zone in your TRMNL account settings. If that differs from the time zone you view the Metrics page in, the daily bars can shift by a day.
- Delay: The display can trail the Metrics page by up to about 30 minutes. See How often it refreshes.